The Problem
When I started at Silicon Forensics, we were testing our Faraday bags using a competitor’s desktop application. It had two major limitations:
- It could only test 10 bags per session — after that, you had to restart the entire application. When you’re doing QC on a production run, that kind of friction adds up fast.
- It didn’t show you when or how the signal dropped — you got a pass/fail at the end, but no visibility into the actual signal behavior during the test. If a bag was leaking at a specific point or the signal was dropping slowly instead of immediately, you had no way to know.
That second problem mattered because we weren’t just testing bags for QC — we also needed data to improve the bag designs. Without seeing the signal curve, engineering had no way to compare different materials, seam designs, or closure mechanisms.
I started working with management to build an app that would solve both problems: unlimited testing with full signal visibility, plus the ability to save and export results for design analysis.
How It Works
Startup — No Data Yet
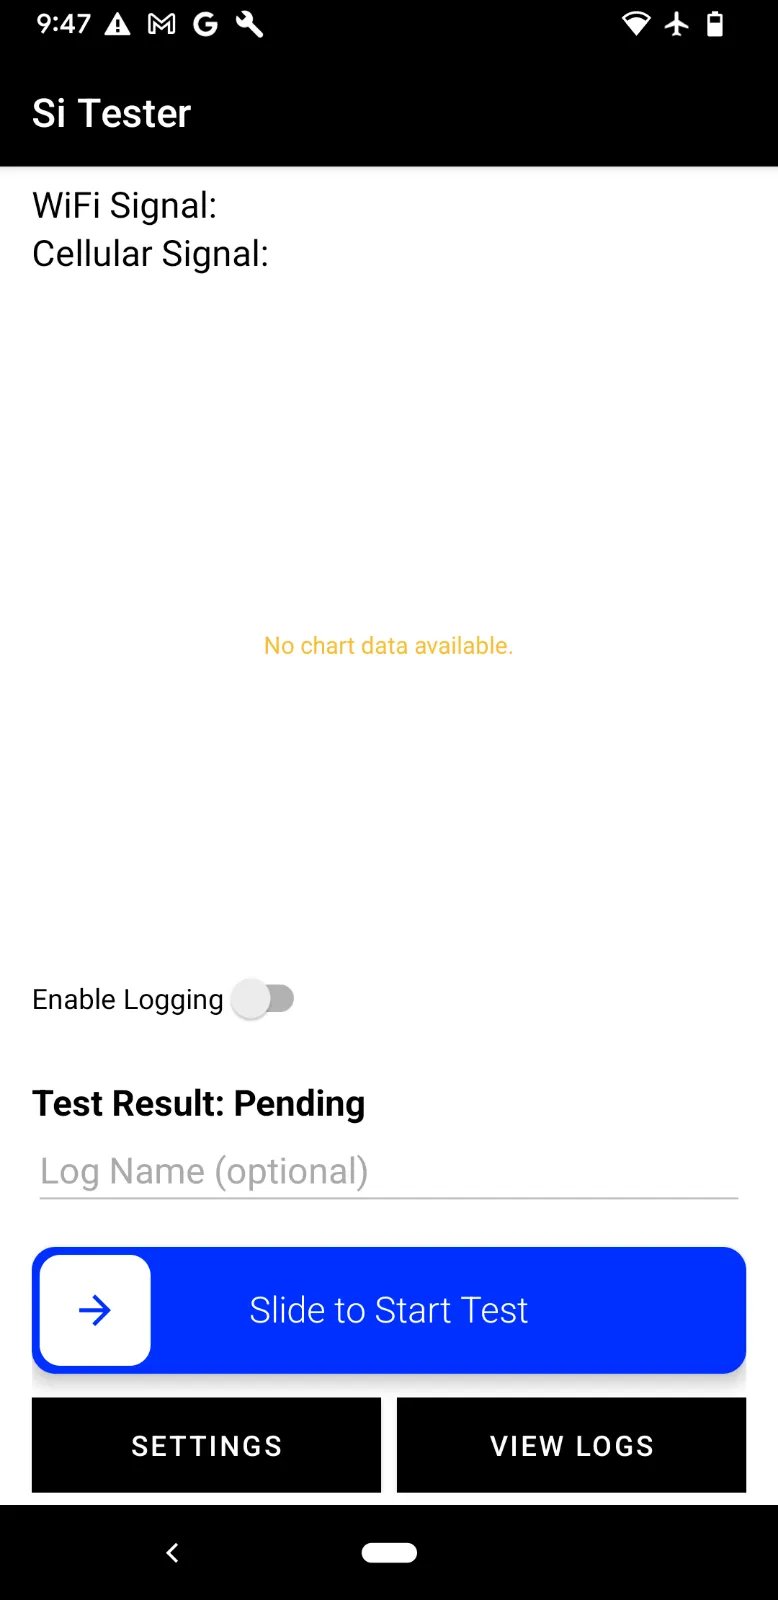
When you open the app, you see the main screen with WiFi and cellular signal readings, an empty chart area, and the “Slide to Start Test” bar at the bottom. The chart shows “No chart data available” until you begin a test. You can also toggle logging and enter a test name if you want to save the results.
Countdown Phase — Placing the Phone in the Bag
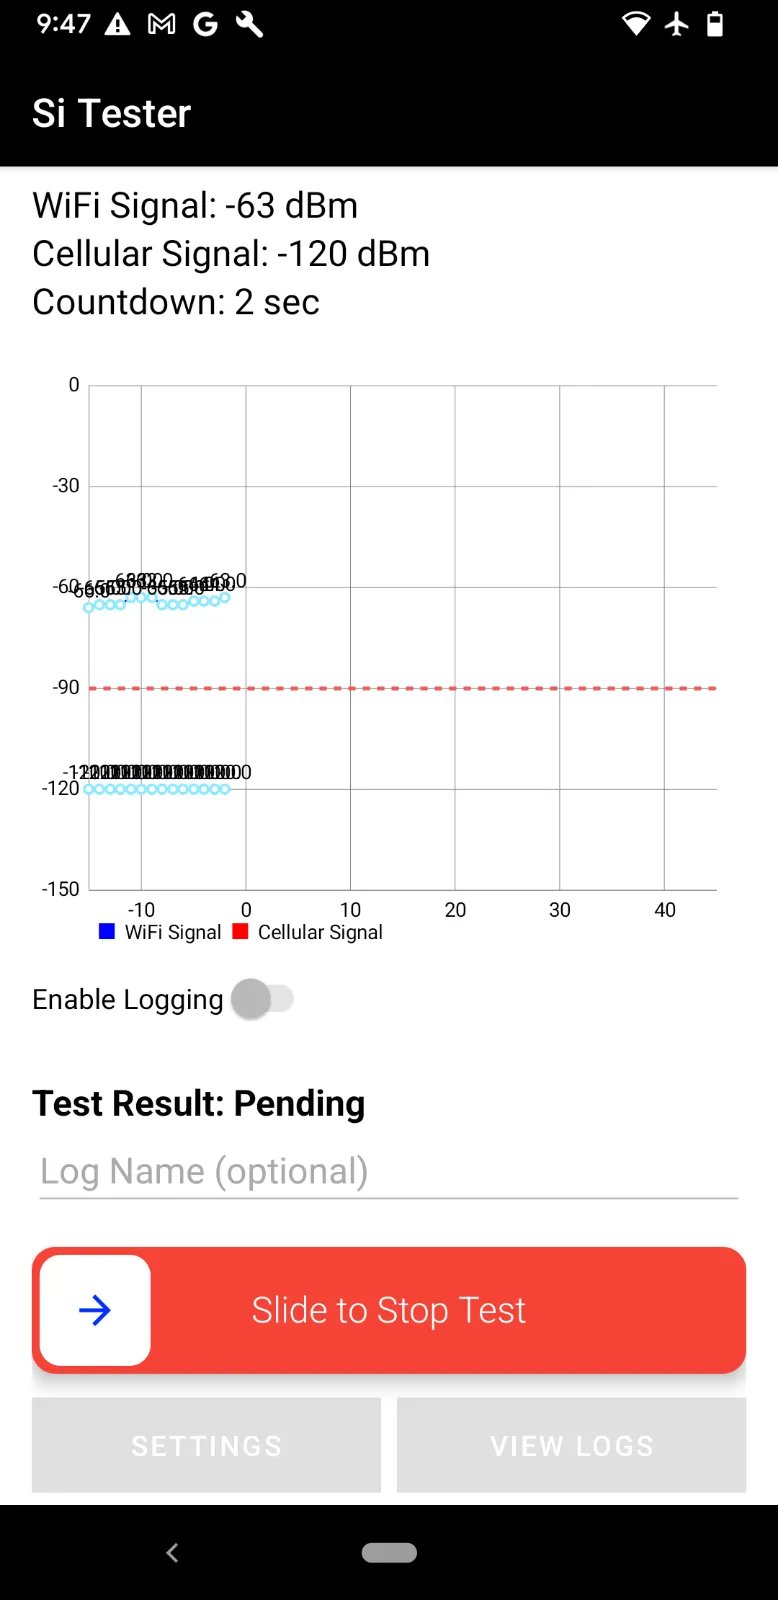
When you slide to start, the app begins recording signal strength once per second. During the countdown phase (configurable, typically 15 seconds), you place the phone inside the Faraday bag and seal it. The chart starts populating immediately — you can see the WiFi signal (blue) and cellular signal (red) in real time, with the dashed threshold line at -90 dBm.
This is the part the old tool completely missed. You can actually watch the signal drop as the bag seals, which tells you a lot about how quickly and completely the shielding is working.
Monitoring Phase — Validating the Seal
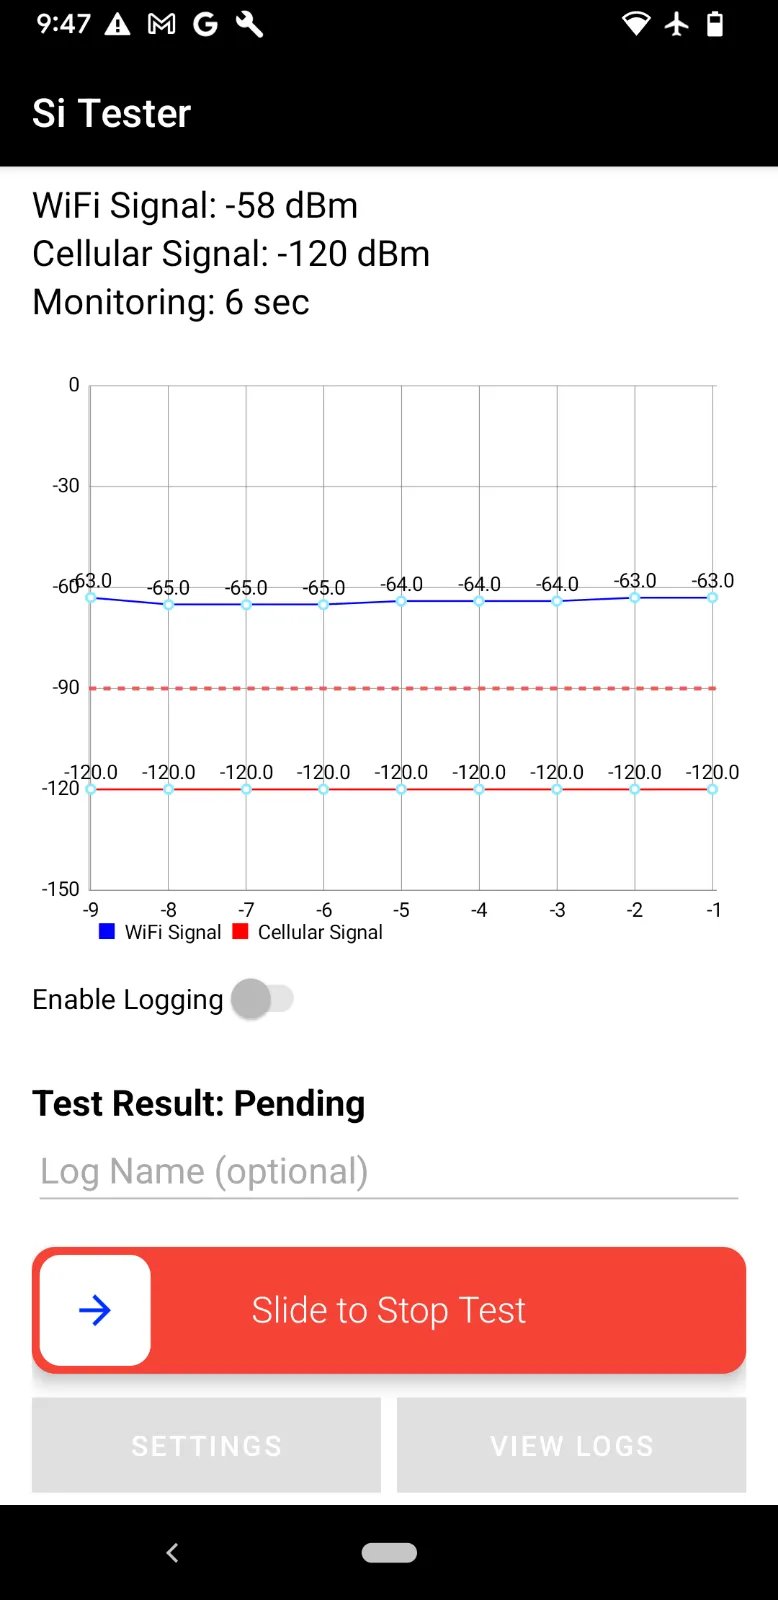
Once the countdown ends, the monitoring phase begins. The app continues sampling every second and checks whether both signals stay below the threshold for the entire test duration. The display switches from “Countdown” to “Monitoring” and you can see the signals holding steady.
In the screenshot above, WiFi is sitting around -58 to -65 dBm and cellular is at -120 dBm. The WiFi signal is above the threshold here because this test was run without a Faraday bag (just demonstrating the app). In a real test with a properly sealed bag, both lines would drop to -127 to -140 dBm — well below the threshold.
Test Complete — Pass
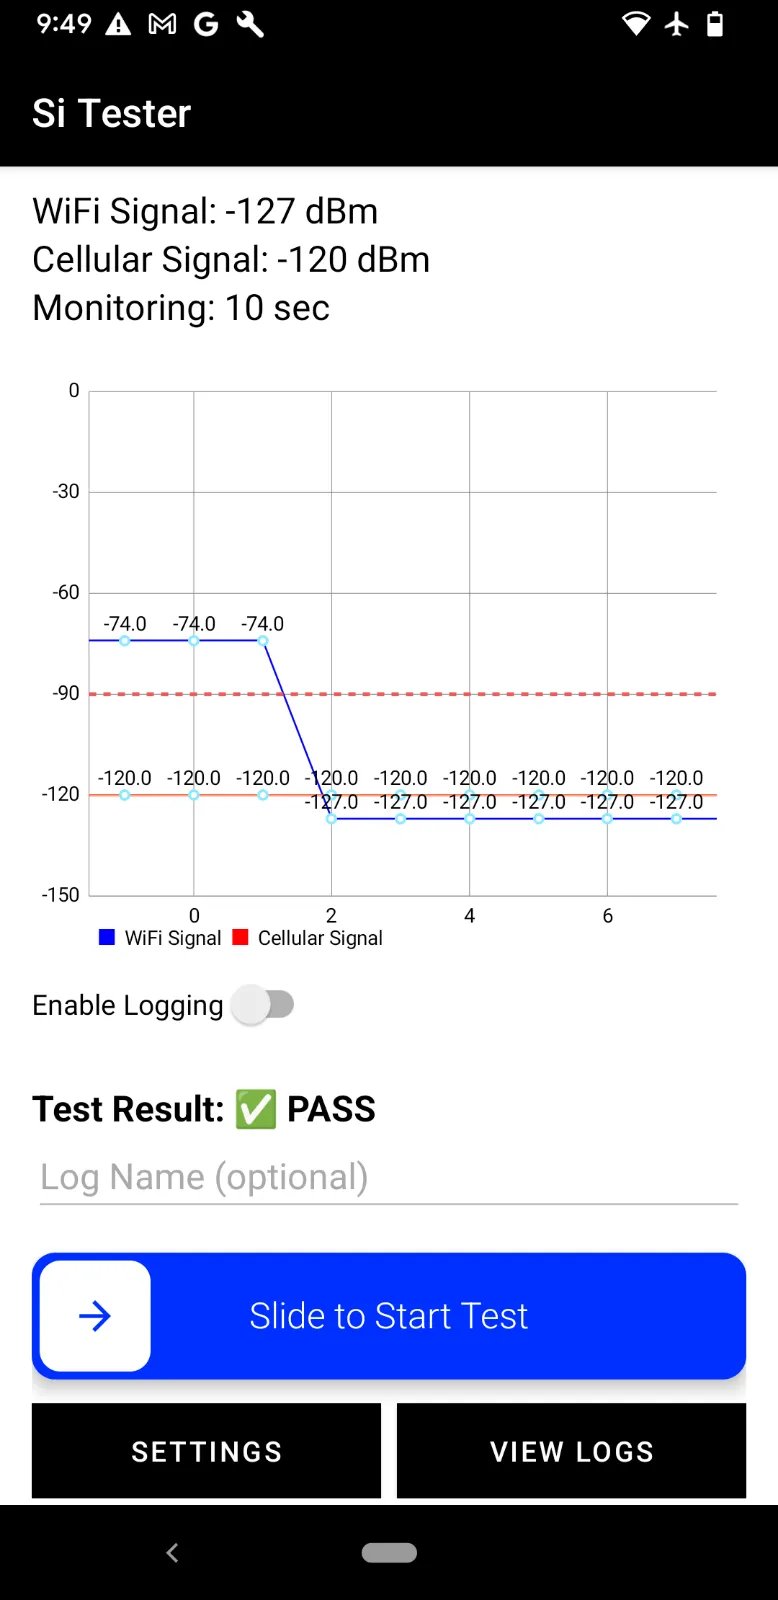
When the monitoring period ends, the app delivers a clear PASS or FAIL verdict. In this screenshot, the WiFi signal (blue) drops sharply from -74 dBm down to -127 dBm right around the x=2 mark — that’s the moment the bag was sealed. The cellular signal (red) stays at -120 dBm throughout. Both signals are well below the -90 dBm threshold for the entire monitoring window, so the test passes.
This is the kind of data that was completely invisible with the old tool. You can see exactly when the signal dropped, how fast it dropped, and how stable the isolation is over time.
Log Detail — Reviewing a Failed Test
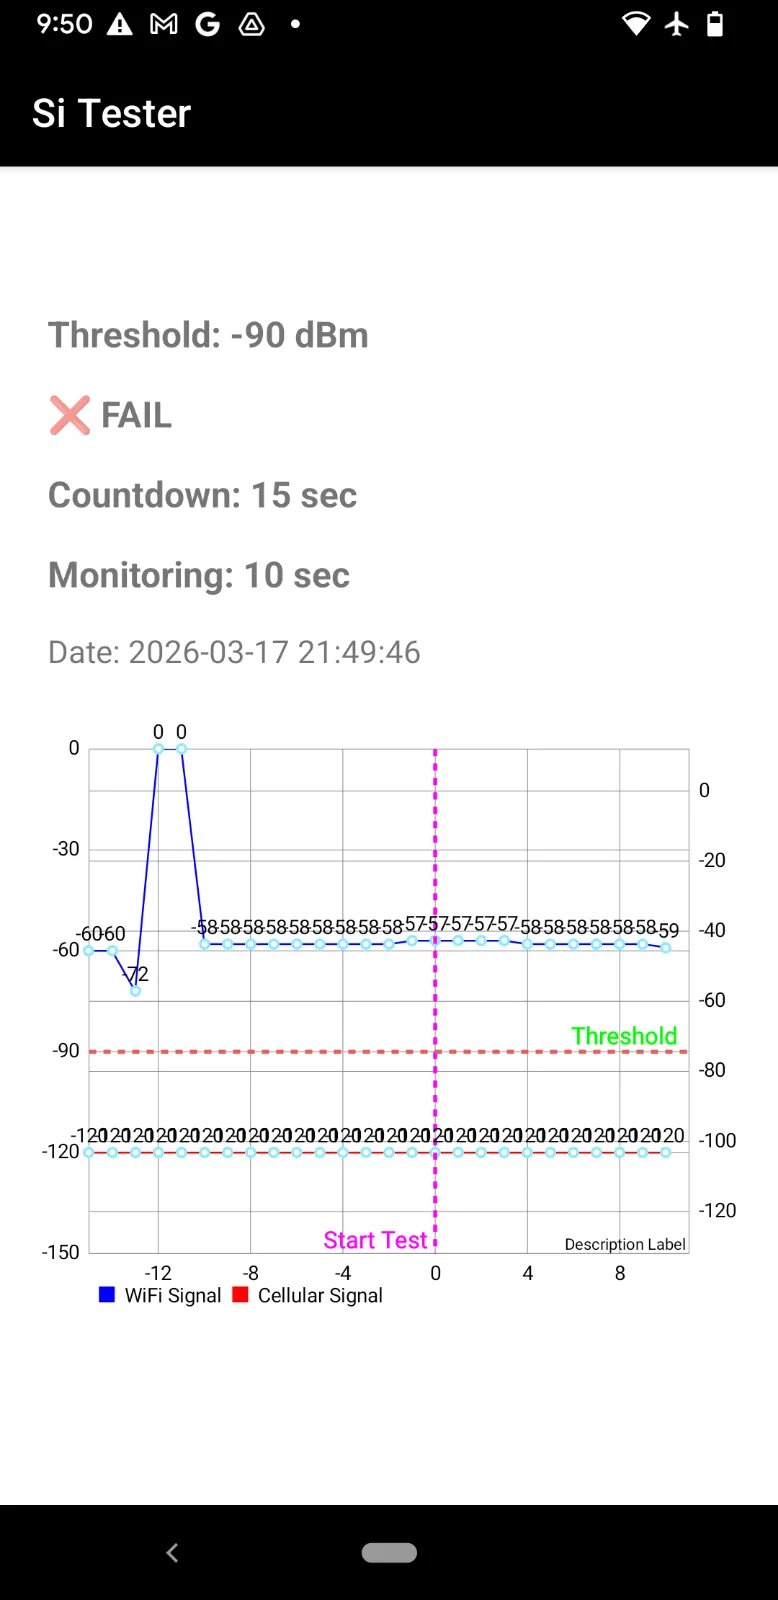
Every test can be saved with a name and timestamp. When you open a saved log, you get the full signal graph reconstructed from the stored data, including the threshold line (green dashed), the “Start Test” marker (magenta dashed at x=0), and the pass/fail verdict.
In this failed test, you can see something interesting — the WiFi signal briefly spikes to 0 dBm at the beginning (around x=-12), which means the phone momentarily lost and re-acquired the WiFi connection. That kind of behavior is visible in the graph and helps diagnose issues with the bag seal or the phone’s radio behavior.
CSV Export — Data for Engineering
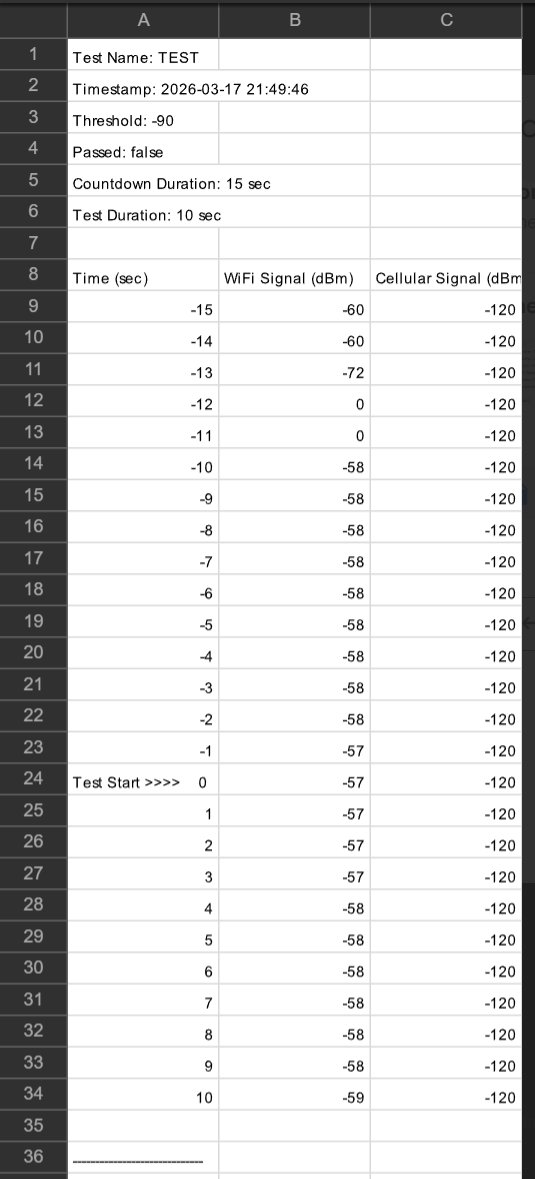
The app can export all saved test logs to a CSV file that lands in the phone’s Downloads folder. Each export includes the test metadata (name, timestamp, threshold, pass/fail, durations) followed by a time-series table with WiFi and cellular readings at every second.
This was a key requirement from management. Engineering can now pull the CSV data into Excel or Google Sheets, overlay tests from different bag designs, and compare signal attenuation curves side by side. It turned the app from a simple QC tool into a design validation instrument.
App Architecture
The app is built with Kotlin in Android Studio and consists of four activities:
MainActivity — Signal Monitoring & Test Engine
The core of the app. Uses Android’s WifiManager and TelephonyManager APIs to read signal strength:
private fun getWifiSignalStrength(wifiManager: WifiManager): Int {
    return wifiManager.connectionInfo.rssi
}

private fun getCellularSignalStrength(signalStrength: SignalStrength): Int {
    return signalStrength.cellSignalStrengths.firstOrNull()?.dbm ?: -120
}
A Timer fires every 1000ms, sampling both radios and feeding data points to an MPAndroidChart LineChart that updates live. The chart shows WiFi in blue and cellular in red, with a dashed threshold line and a vertical “Start Test” marker at x=0.
The slide-to-start UI uses the SlideToActView library. When a test is running, the slider turns red and changes to “Slide to Stop Test,” and the Settings and View Logs buttons are disabled to prevent accidental navigation.
SettingsActivity — Test Configuration
Configurable parameters stored in SharedPreferences:
- Fail Threshold — Signal level in dBm that defines pass/fail (default: -90 dBm)
- Test Duration — How long signals must stay blocked (minimum 10 sec, recommended 45–60 sec)
- Countdown — Grace period for placing phone in bag (recommended 15–20 sec)
LogActivity — Test History
Stores test results as JSON objects in SharedPreferences, sorted newest-first. Features include tap to view detail, long-press to delete, clear all, and Export to CSV which generates a timestamped file and shares it via Android’s share sheet.
LogDetailActivity — Graph Replay
Reconstructs the full signal chart from saved JSON data, including the threshold line and start marker. Allows reviewing past tests without re-running them — useful for comparing results across different bag designs or identifying bags that are degrading over time.
Test Procedure
The app was designed for operators on the manufacturing floor:
- Connect to WiFi — Ensures both WiFi and cellular radios are active
- Configure settings — Set threshold, countdown, and duration (usually done once)
- Enable ringtone — Phone alerts when test completes while sealed inside the bag
- Slide to start — Begins countdown and signal recording
- Seal in bag — Place phone in Faraday bag during countdown
- Wait for alert — Ringtone sounds when monitoring completes
- Review results — Check pass/fail and inspect the signal graph
Impact
- No session limits — Test as many bags as you need without restarting
- Full signal visibility — See exactly when and how the signal drops, not just pass/fail
- Design validation data — CSV exports let engineering compare bag designs quantitatively
- 60% faster validation — From manual back-and-forth to slide-and-wait
- Manufacturing floor ready — Slide-to-start UI, ringtone alerts, minimal setup per test
Tech Stack
- Language: Kotlin
- Platform: Android (API 29+, tested on Pixel 9 Pro)
- APIs: WifiManager, TelephonyManager, PhoneStateListener, MediaPlayer
- Charting: MPAndroidChart (LineChart with real-time updates)
- UI: Android XML layouts with SlideToActView, ViewBinding
- Storage: SharedPreferences (JSON), CSV export to Downloads
- Permissions: ACCESS_FINE_LOCATION, ACCESS_COARSE_LOCATION